We are at the point of the economic cycle where I really just get two questions: Are we going into recession and are home prices about to fall? I am going to do my best to try to make sense of what is happening with the housing market right now, since the years 2020-2024 have been a talking point of mine for years and my biggest concern since the fall of 2020 has been prices overheating — not having a deflationary collapse.
For over a decade, a lot of people didn’t believe in housing inflation but in the deflationary housing story, which hasn’t ended well for them since 2012. Talking about this from a historical standpoint will help us understand better what is happening today.
I have separated my work into two different time frames: 2008-2019 and 2020-2024.
In the years 2008-2019 we saw the weakest housing recovery ever. I predicted that purchase application data wouldn’t reach 300 until years 2020-2024 and housing starts wouldn’t start a year at 1.5 million until then as well. In contrast, I knew 2020-2024 would have the best housing demographic patch ever as the country’s biggest demographic group hits the median age for first-time homebuyers.
Let’s look back at how some people have interpreted housing market data.
A short history of the housing crash narrative
2012: What they said: Shadow inventory will cause prices to fall. The reality: Inventory broke down in 2012, and the monthly supply data got below 6.0 months. The “shadow inventory” was not an issue as it took years to get rid of the distressed supply from the housing bubble years.
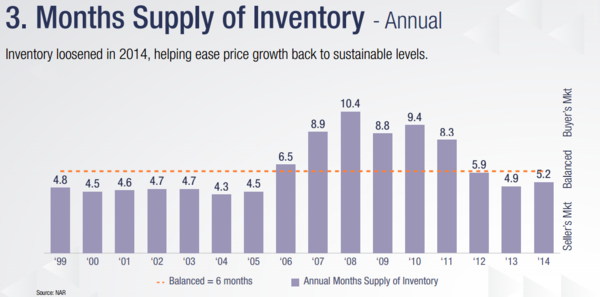
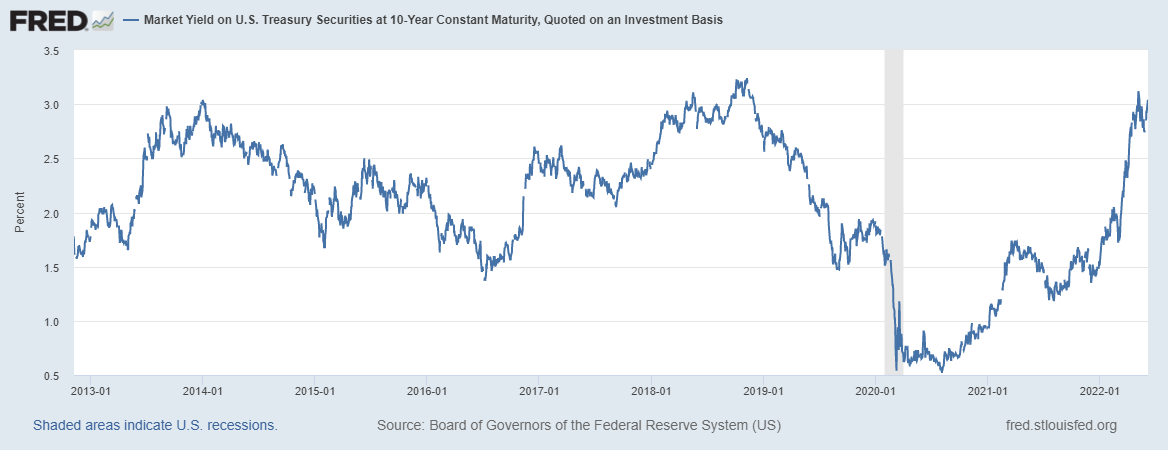
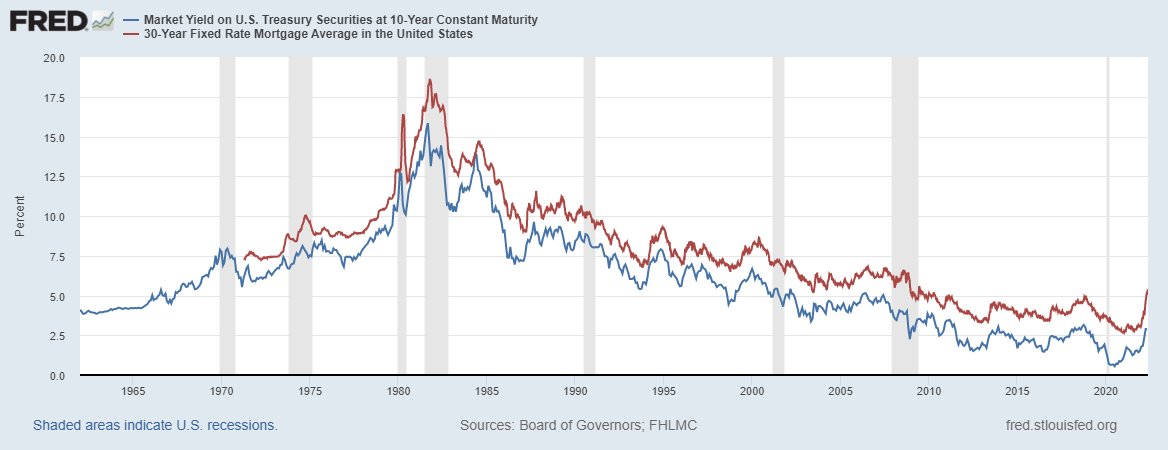
2013: What they said: Because mortgage rates were rising and the Fed was tapering, housing would crash. The reality: The 10-year yield shot up from 1.60% to 3% (sound familiar?), making housing cool down noticeably. Nominal home price growth cooled down, but we had no negative year-over-year price declines as inventory didn’t even get over five months back then.
2014: What they said: Housing would crash because purchase application data was down 20% year over year; adjusting to the population, it was the lowest ever. (Total inventory grew this year, and sales were negative. This was the last time total inventory did grow in America.) The reality: Even though sales fell and inventory grew, nominal home prices didn’t decline since the monthly supply of homes never came close to breaking over six months.
NAR total inventory data:
2015: What they said: This was the start of the Silver Tsunami. The first baby boomer turned 62 in 2008, and thus 2015 was the start of what they said would be a mass downsizing that would collapse prices because nobody could buy a home from the Boomers, and they needed to discount their net wealth by 70% to have a smaller home to live in. The reality: The Silver Tsunami didn’t happen; this was supposed to be a decade-long process up to 2025, and still hasn’t happened.
2016: What they said:Because manufacturing was in a recession, and stocks pulled back 15%, people were pushing a general recession premise. The reality: Home prices grew because inventory fell once again. (Here’s me on a treadmill challenging those calling for a recession.)
2017: What they said: Because home prices were back to the housing bubble peak, prices had to crash. The reality: Inventory fell again and home prices rose.
2018: What they said: With mortgage rates rising to 5% and the new home sales sector getting hit hard, housing would crash. The reality: The existing home sales marketplace was in much better shape. Sales fell, but the total inventory still didn’t grow. The monthly supply data increased as it took longer to buy homes: there was no inventory growth and purchase application data were only negative for three weeks out of this year.
2019: What they said: Housing would crash because Inventory was up year over year on the monthly supply data for a few months, and the sales trend was still falling. The reality: As rates fell, housing rebounded in the second half of 2019. I enjoyed the 2019 housing market because real home prices went negative briefly, and people had choices. Not many people liked this market, but it was as good as it gets because the days on the market climbed to over 30 days and we had no drama.
2020: COVID-19 hit us and thus the housing crash premise went into overdrive. Even though I tried my best in 2019 to warn my housing bubble friends not to go there with a bubble crash, they did. I was willing to forgive them early on since it was our first global pandemic in recent history and the economy paused, leading to a drastic downturn in economic activity. What they said: COVID would lead to a housing crash. The reality: I wrote on April 7, 2020, we would have an economic recovery in 2020 if you follow these data lines and dates. Regarding housing, I said please wait until July 15 to see June’s data before you go all housing crash on us. They didn’t wait and missed the greatest recovery ever. I retired that economic recovery model on Dec. 9 2020, and now we were dealing with the Forbearance Crash Bros.
2021: What they said:After failing with another housing crash call, what do all crash call boys and girls do? They move the goal post to next year and the theme was forbearance —all the people coming off of forbearance would crash the housing market. The reality: Data was stable and most people making over $60,000 a year got their jobs back by October of 2020.
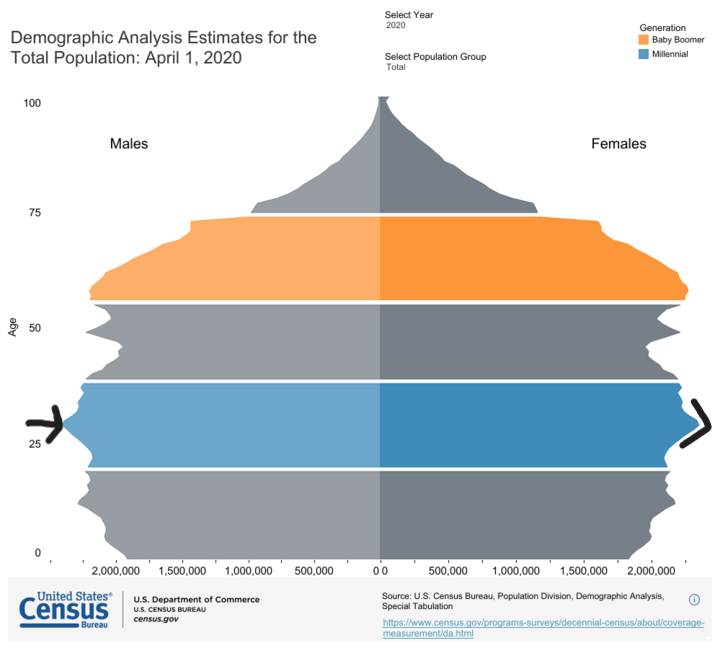
Now that we have that 10 years of history on the books, it’s time to talk about the future because the housing market has had a material change based on my own economic work. One thing is for sure, demographics are economics, and mother demographics flexed her muscle during COVID-19. Ages 28-34 are the biggest age group ever and when you add them with move-up, move-down, cash, and investor buyers together, you have solid replacement demand.
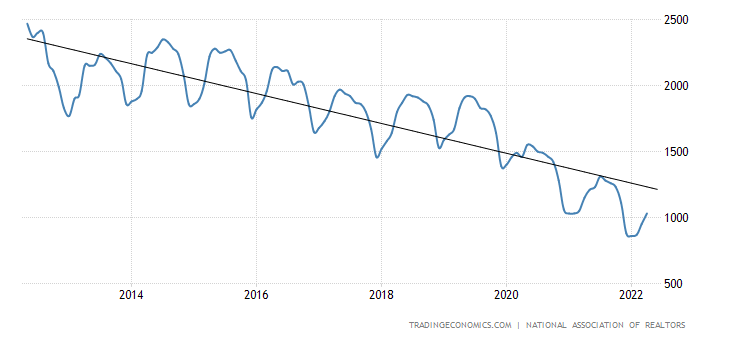
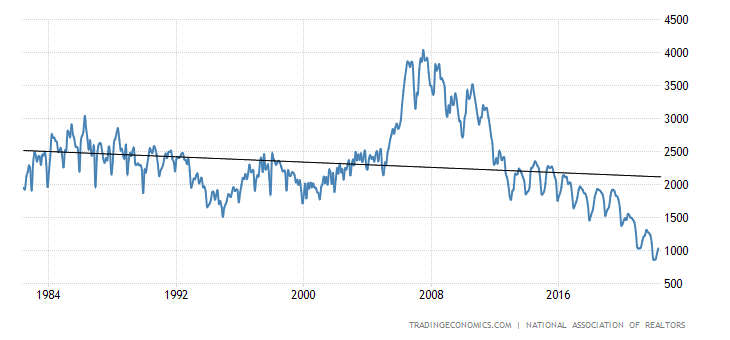
This also means we might have problems with inventory as well. As you can see here with the NAR total inventory data, total inventory has been falling since 2014, but with a bump in demand, we had the potential to break under 1.52 million. Historically, 2 million to 2.5 million of inventory is normal. Post-2014, a slow but potential dangerous downtrend formed right when our demographic patch was about to kick in.
NAR total inventory data going back to 1982
My rule of thumb for years 2020-2024: As long as home prices grew just at 23% or less during these five years, the sales goal of having over 6.2 million total home sales should be achievable.
Unfortunately, so far 2020 and 2021 got a terrible grade on home-price growth. It was too hot. The home-price growth was an apparent deviation from what we experienced in the previous expansion. Rising home prices was the real housing crisis this time around. A raw shortage of homes created forced bidding during a better demographic patch, and we are still today seeing home-price growth gains that are way too hot.
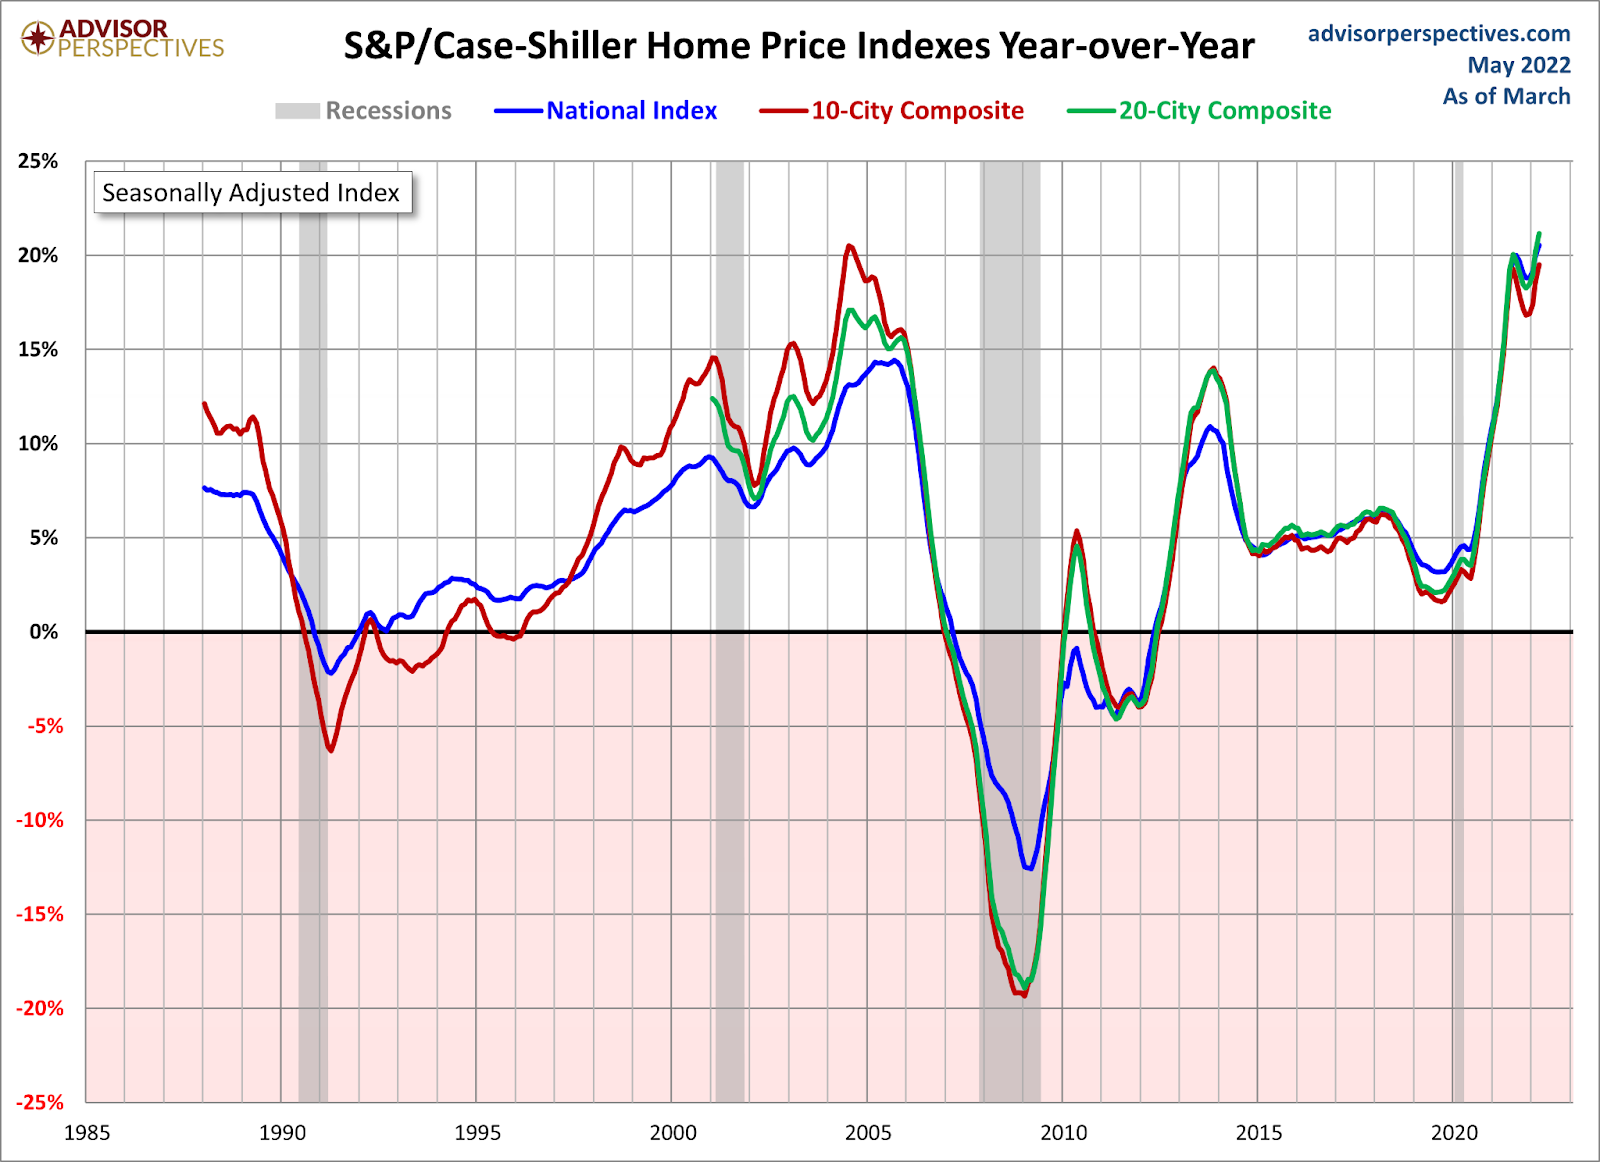
Now data from the S&P Case Shiller Index lag, but you can see the damage done in such a short time with prices.
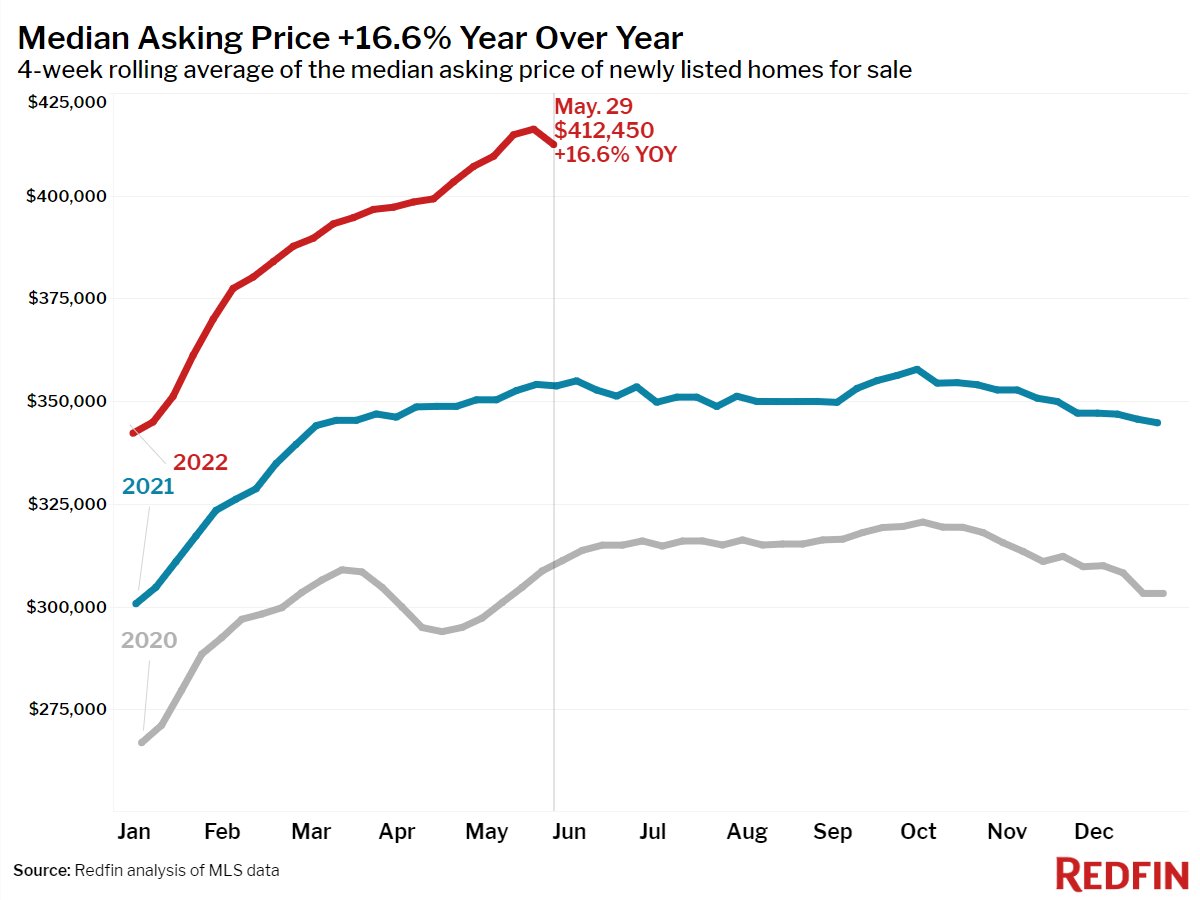
Even with some of the recent weakness in demand, we haven’t seen a significant dynamic shift yet to bring prices down because total inventory data is still too low. Here are some weekly data from Realtor.com and Redfin.

I do believe higher mortgage rates work, but it needs time to work itself in our housing market.
What do we need to see before home prices fall?
Traditionally, people believe you need six months of monthly supply because that happened during the housing bubble crash. That was a forced selling period, and the credit stress data from 2005 through 2008 isn’t here.
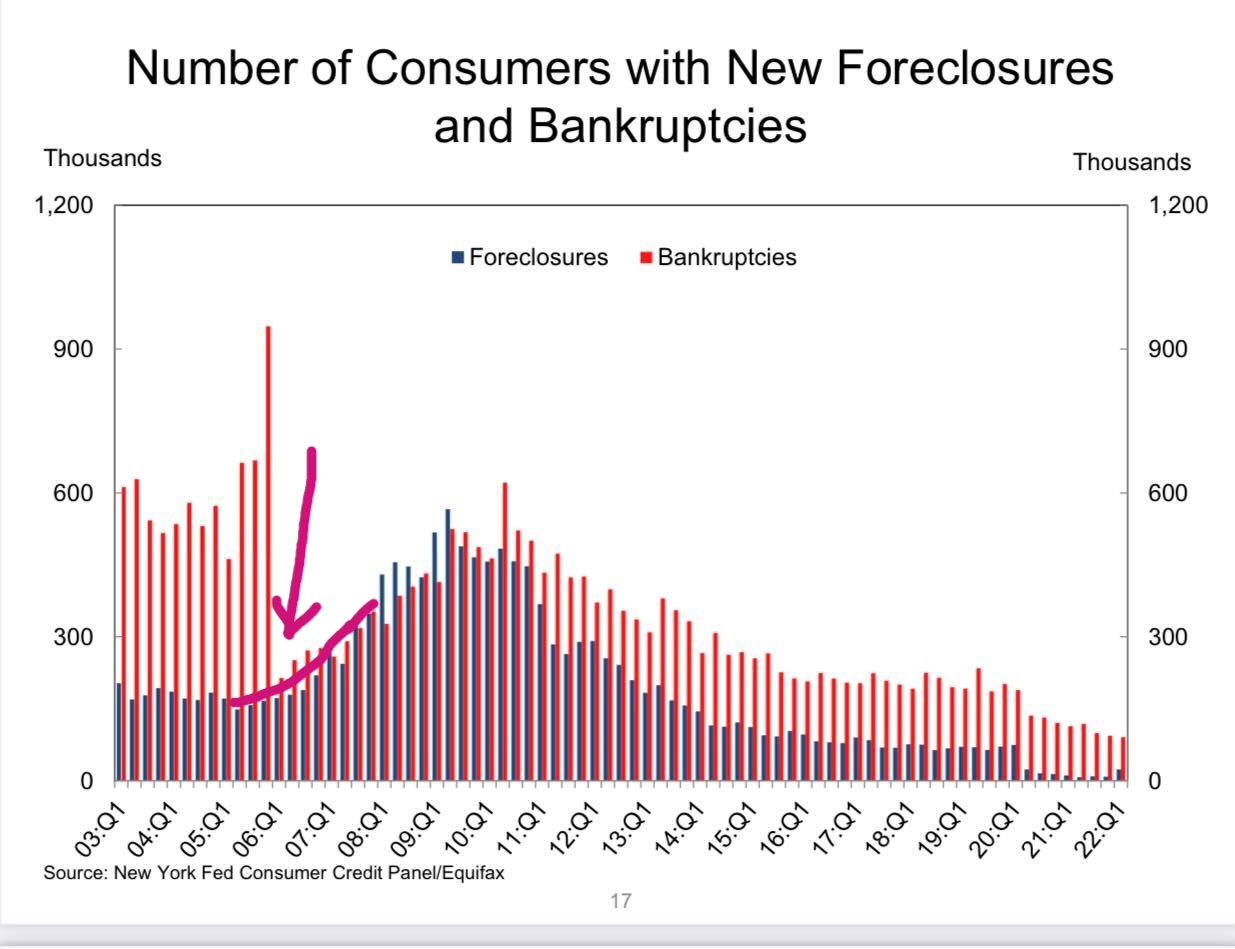
American homeowners are in an excellent financial position, and they’re not going to sell their homes at 30%, 50%, or 70% off the market bid prices to get out at all costs. We are in June now, and the market inventory data inventory is nowhere close to 2018 levels nor 2014 or 2010 levels. Looking back at total inventory data going back to 1982, when I was seven years old, the only panic selling we saw was forced credit stress selling. The homeowners now don’t have exotic loan debt structures they need to recast, and their cash flow is good.
RIP my price model
I lost my price growth model, and I want it back! Imagine if home prices grew at 4.6% or less per year from 2020 to 2024; we would have so much leeway for prices to rise without impacting demand enough to get us under 6.2 million total home sales. However, that is not the case! And once the 10-year yield broke over 1.94%, we can see that demand is being hit more than it would have if price growth were much tamer.
The marginal homebuyer is always impacted; that would not have changed if price growth was less, but the massive price gains since 2020 have made things a lot worse.
This means home prices need to decrease for my model to work again before 2024. Does this mean I will get want I want? What am I looking for now?
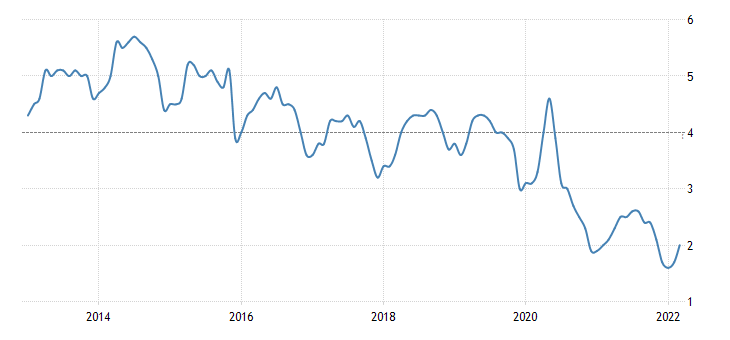
First, we need to get monthly supply data above four months with duration. The last existing home sales report came in at 2.2 months. So we aren’t there yet, but once we get above that, you have a more traditional housing market regarding supply.